Sometimes you can watch the ocean from afar, and sometimes you need to get a magnifying glass and see how the tide is pushing each grain of sand.
MRTG is a tool licensed under the GPL that can be used to gather network usage data. Want to know how much bandwidth a box is using over the past day, or the past week, or the past month? MRTG can draw you a graph:
What can you do with a graph? Be lazy, of course! Rather than get worked up when you get an email from your ISP with a large bill for network overages, you can sit back and contemplate the capacity planning you did to make sure that you’ve purchased the right amount of bandwidth.
Sadly, you can’t count on the rest of the world to conspire with you to maintain your virtuous laziness. If you start seeing massive spikes in usage, you have to investigate. Sometimes the source is obvious: an ill-behaved web crawler, somebody confusing your server for Akamai, i.e., something that shows up in the usual logs. If it’s not that obvious, you may need to bring out a magnifying glass.
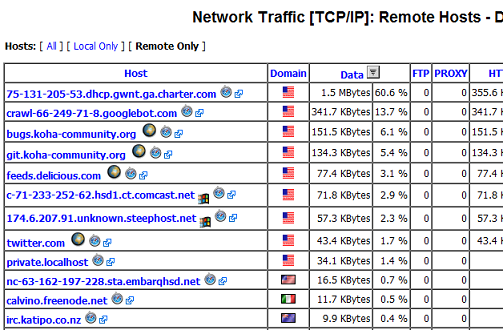
nTop can also be used to monitor network traffic, but unlike MRTG, it’s focus is on the details: not just how much is used, but how much is used by host:
Found the culprit and throttled it? Time to sit back again.


